Measures are necessary and everyone’s desire. Metrics are how all professionals evaluate performance and make judgments, be it internet marketers, NFL scouts, or high school math teachers.
Digital marketing provides significantly more visibility into activities and behaviors than previous marketing platforms. Although you can’t precisely know how many people are viewing your billboard on the side of the road, you can see how many are visiting your website.
Although you might not be exactly sure how many people visited your restaurant as a result of an advertisement in the local newspaper, you are aware of the number of individuals that arrived at your website through a banner ad.
Since the very inception of digital marketing, this insight into your digital ins and outs has essentially been its industry. It is becoming more and more popular to use metrics and terminology like Google Analytics, visitors, pages per visit, bounce rate, time on site, and conversion rate.
In reality, a Statista analysis indicates that merchants mostly use the following measures to assess the effectiveness of per
sonalization initiatives:

But those indicators don’t always make ecommerce sing, which is why more perceptive, useful, e-commerce-focused measures have been created.
Before discussing the essential metrics that might enhance the performance of your store, it’s important to know what metrics are and what to look for.
What is a Metric?
Any measurable, regularly established assessment of a website’s performance is called a metric.
The average order value (AV0), cart abandonment rate, and traffic sources are a few examples of significant e-commerce indicators.
There’s solid justification for the length of the e-commerce metrics list. Rich data sources such as Google Analytics, social media, your online store, product pages, homepages, checkout, and shopping carts all collect quantitative data that is ready for your analysis and long-term trend evaluation.
What is a KPI?
The term “key performance indicator” (KPI) is used. All metrics are useful, but since a KPI is the number you monitor for growth, it is particularly crucial to monitor it.
While site inspections could be required, your key performance indicator might be the orders themselves. You are often assessed based on a small set of very important metrics. These KPIs are for you.
What Distinguishes an Ecommerce KPI from a Metric?
What distinguishes a KPI from a metric, particularly because the terms are frequently used interchangeably?
First, let’s acknowledge that although KPIs track the performance of processes, measurements track the processes themselves. Stated differently, KPIs are precise, arbitrary goals that you would like to have met by your store.
The average order value, for instance, is a metric rather than a KPI. A $40 AOV target, on the other hand, is a KPI. In the context of sports, points-per-game (PPG) would be a measure, and 30 PPG would be a key performance indicator (KPI).
How to Measure Ecommerce Success
Making an index that summarizes your effectiveness across a few different e-commerce marketing platforms is beneficial.
For instance, if you are the owner of an online store, you could choose four metrics and identify the key performance indicators (KPIs) for each of those metrics. Your index would be.95 if two of those measures are operating at 90% of your KPI objective and the other two are operating at 100% of your KPI goal.
Weighing your metrics could improve this even further—perhaps one of the four is more significant than the others? At least not initially, we would advise against doing it.
The details of the activities that make up your metrics can be managed by your teams or team members, depending on your size, but this index can be a useful tool for gauging your performance at the corporate level.
How Often Should I Check My Ecommerce Metrics?
You may be asking how frequently to monitor your metrics as we go through our list of suggested ecommerce KPIs.
The response is the same as to the question, “What is the price of a red car?”
“It depends” is the response.
Weekly
To make sure your company is doing well, you should review certain KPIs once a week. Examples could include impressions and traffic to websites on social media.
Bi-weekly
Expanding upon your weekly metrics, bi-weekly metrics work best with bigger sample numbers because they are less susceptible to variances that could occur within a given week.
These bi-weekly KPIs could be shopping cart abandonment, cost per acquisition (CPA), and average transaction value (AOV).
Monthly
Because of traffic patterns or, more likely, your own marketing practices, monthly metrics call for a lengthier data window. Email open rate, multichannel engagement, reach, add-to-cart abandonment, and other micro-conversions are a few examples of these monthly KPIs.
Quarterly
As these periods define it, quarterly measurements are the most strategic.
These quarterly measurements will be the long-tail activities that show your firm is thriving and expanding if your weekly and bi-weekly metrics have shown that it is strong and surviving. Email click-through rate, client lifetime value, and subscription rate are a few examples of these.
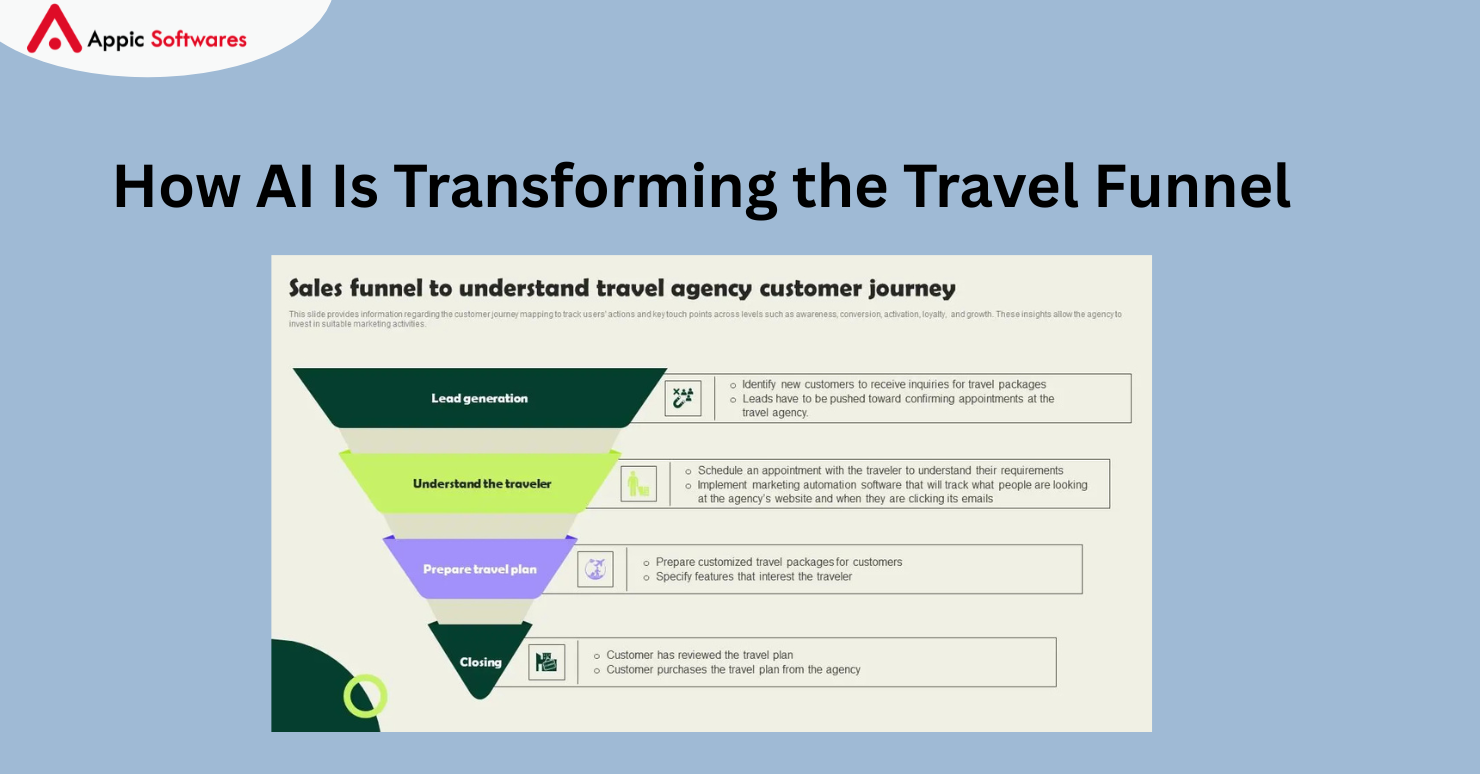
Understanding Customer Stages
We’re going to structure this discussion around how the best-performing e-commerce companies typically assess the performance of their stores: using the e-commerce funnel, as illustrated in the above picture.
There are distinct and more pertinent metrics at every stage of this funnel. Despite what the general public believes, none of these phases are intrinsically more significant than the others. Your personal preferences, enterprise strategies, and stage of the company lifecycle will determine how important one is to the others. For example, building advocacy is harder early on in a corporation.
For you to manage a profitable online store, the following metrics are perhaps the most crucial ones:
- Impressions.
- Reach.
- Engagement.
- Email click-through-rate.
- Cost per acquisition (CPA).
- Organic acquisition traffic.
- Social media engagement.
- Abandonment.
- Micro to macro conversion rates.
- Average order value (AOV).
- Sales conversion rates.
- Customer Retention rate.
- Customer lifetime value (CLV).
- Repeat customer rate.
- Refund and return rate.
- Ecommerce churn rate.
- Net promoter score (NPS).
- Subscription rate.
- Program participation rate.
Product discovery metrics
Although it may sound simple, if you don’t raise awareness of your brand, people won’t find your website and you won’t be able to draw them in.
You can use these measures to gauge the effectiveness of your awareness-raising and discovery-promoting efforts:
Impressions
Impressions are only the quantity of times someone sees your advertisement or other content. These impressions may come from sponsored advertisements on external websites, search engine results, social media posts, etc.
It’s critical to keep in mind that an impression does not always translate into a click. Any network you use to share material will be able to track your impressions, including third-party platforms, Facebook, Instagram, and Google sponsored ads.
Since impressions are largely determined by the amount of money you spend on your many initiatives, they are among the most manageable metrics you may have.
Reach
Simply expressed, reach is the total number of people who follow and subscribe to your material, or in other words, the total number of people who will see it. This might include members of your loyalty program, Facebook followers, and opt-in email subscribers.
Consistent email, social media, or other campaigns to promote followers, subscribers, etc. are the greatest ways to increase reach. Your marketing efforts to increase reach will be more successful the more well-defined your brand and voice are.
Engagement
The point where your impressions and reach converge is engagement. In essence: the number of people who interact with your material (your impressions) out of all of your followers and subscribers (your reach).
This could comprise click-through and other acquisition-related activities, as well as non-acquisition-related actions like likes and shares.
The best way to increase engagement is to keep promoting your product and brand. It’s critical that these
efforts be made consistently. These endeavors have considerably more resemblance to continuous farming than to sporadic hunting.
Important Metrics That You Should Have A Look At
Consideration (Or Acquisition) Metrics
The point where your impressions and reach converge is engagement. In essence: the number of people who interact with your material (your impressions) out of all of your followers and subscribers (your reach).
This could comprise click-through and other acquisition-related activities, as well as non-acquisition-related actions like likes and shares.
The best way to increase engagement is to keep promoting your product and brand. It’s critical that these efforts be made consistently. These endeavors have considerably more resemblance to continuous farming than to sporadic hunting.
Email Click-Through
The number of email subscribers that clicked through to your website after receiving and opening the email (together with other metrics) is known as the email click-through rate.
Creating professionally designed emails with compelling calls to action, responsive design, and attention-grabbing subject lines will have a favorable effect on this.
Cost Per Acquisition (CPA)
Would it be useful to know your customer acquisition cost (CAC), or the amount you spend on bringing in new clients? We’ll interpret it as a yes, therefore it’s critical to ensure you’re not launching costly ads that result in a negligible amount of clients.
As a retailer, you are aware that to increase traffic and, eventually, sales, you will need to spend money on email campaigns, sponsored search ads, and other marketing initiatives. But you’re squandering vital funds if the expense of those efforts exceeds the overall amount of money they’re bringing in.
It’s critical to remember that the context of your AOV provides significant benefits to CPAs. It’s encouraging if your AOV is $100 and your CPA is $25. However, a CPA of $25 doesn’t seem all that wonderful if your AOV is $30.
By carefully allocating your campaign budget, creating landing pages that support your call-to-actions, and segmenting your campaigns to more effectively target clients who would respond to them, you may increase your campaign’s cost per acquisition (CPA).
Organic Acquisition Traffic
Eventually, you want visitors to your website who come to you freely. Measuring the percentage of visitors who arrive at your website through organic means is crucial and can be found in most analytics tools.
By making sure that your off-page SEO is performing properly and that your on-site/technical SEO adheres to best practices (correct tagging, decent response time, etc.), you may increase your organic traffic.
Social Media Engagement
Social media analytics have a lot to offer your e-commerce business. The main KPIs for social media interaction that you should monitor frequently are as follows:
Likes on each post: “Likes” is a general indicator of who has re-voted your content on social media. These can take the shape of +1s, favorites, thumbs-ups, or likes. You must total the likes on all social media platforms and divide that total by the total number of posts on each platform to compute it.
Shares per post: The term “Shares” refers to all metrics, including “retweets,” “repins,” and “shares.” This measure shows how frequently posts are shared on average over a specified period.
Remarks per post: The term “Remarks” refers to all mentions and remarks made on your social media postings. This indicator shows you how big of a social media following your brand is building.
Clicks per post: Over a specified period, the clicks per post metric counts the number of link click-throughs from social media posts. Gather all of the clicks on your social media postings throughout a given time frame (usually more than a month) and divide the total by the total number of posts that were published during that same time frame to get this measure.
Conversion Metrics
If you’re fortunate enough to have a consumer visit your store, how can you assess how well you performed in getting them to add items to their shopping basket, check out, and become a paying customer?
This is what these measurements ought to assist you with:
The shopping cart abandonment rate
It is useful to measure site behaviors since abandonment can be quantified in a few different ways.
The number of visitors to your website who add items to their cart but then leave without buying is known as shopping cart abandonment. Before proceeding to the checkout process, this step is essential to determine whether there are any issues with the website or cart procedure.
Checkout abandonment
A crucial indicator of how many visitors quit your website without completing a transaction is checkout abandonment, which is measured separately but only after the visitor has started the checkout process.
Although they are comparable to shopping cart abandonment, it is crucial to measure them independently to determine whether the checkout procedure is the primary reason for abandonment or whether there is another issue.
The main way to lower your abandonment rates is to provide smart cart management, which includes urgency messaging, persistent pages, cart storing, etc.
Micro To Macro Conversion Rates
This method of determining which activities are especially crucial for assessment is intriguing. Small (micro) actions that result in bigger (macro) actions are known as micro and macro conversions.
These are comparable to abandonment rates, but they can help you track the number of visitors that click on a product detail page or sign up for an email, for example, or any other activity you deem crucial to your funnel.
Average Order Value (AOV)
The average amount your consumers spend for the products in their cart when they check out is known as your average order value or AOV. It can be measured over time to see how it changes, and it should. Knowing this parameter is crucial for assessing the efficacy of marketing campaigns.
Selling add-ons, loyalty plans, or other, more basic business model issues like price, product quality, etc. might raise your average customer value (AOV).
Sales Conversion Rates
The total number of orders or sales divided by the total number of store sessions is your sales conversion rate.
Knowing this figure is essential to figuring out how much traffic is needed to produce the desired number of sales.
However, you must have a more detailed understanding of conversion rates, just like you would with your sales statistics.
Key methods for analyzing your conversion rate measure are as follows:
- Decide on a conversion rate for each channel, such as Facebook, AdWords, SEO, etc.
- Determine the conversion rate for each product category. Some product categories might convert at a higher rate than others.
- Define the conversion rate for each campaign: collaborating with influencers or affiliates, for instance.
- In your promotions, try to maximize your sales conversion rates: Consider investing more in a channel or category that is performing well. Sometimes it’s best to cut your losses. If something is underperforming, perhaps there is a tweak that would increase the rates, or perhaps the campaign should be discontinued. Campaign growth can be maximized through conversion rate optimization or CRO.
Retention Metrics
It can cost five to twenty-five times as much to acquire a new customer as it does to keep an existing one, depending on the source. This data clearly shows how important it is to hold onto the clients you have converted.
Keep in mind that a consistent theme—excellent customer service, loyalty programs, promotions encouraging repeat purchases, and a genuine engagement in customer satisfaction—will help all of these retention-focused KPIs.
Customer Retention Rate
The percentage of consumers you keep as clients over time is the best way to describe your customer retention rate. The better your customer service is, the higher this number is.
It’s crucial to keep in mind to deduct your new consumers from the total number of customers while performing this calculation. While gaining new clients is important, this metric focuses on keeping your current clientele.
Customer Lifetime Value (CLV)
Customer lifetime value, or CLV, is the total amount of money an online store makes from a single customer over time, accounting for every order they place. It’s a great way to gauge average customer satisfaction, brand viability, and loyalty.
A view of the company’s long-term financial viability is given by the CLV metric. High CLV is a sign of brand loyalty, product-market fit, and recurrent revenue from repeat customers. If e-commerce companies want to see consistent growth, they should track and maximize customer lifetime value.
Repeat Customer Rate
It is crucial to measure the rate of repeat business, which is simple to perform. What proportion of your clients have made multiple purchases is something you should know.
Because satisfied customers are loyal to you, this is an additional way to gauge how well you’re serving them.
Refund and Return Rate
For e-commerce companies, refund and return rates can be a nightmare. High refund and return rates have the potential to cripple even the most profitable e-commerce sites. Returns may be common and already factored into your financial models, or they may be rare, depending on your sector.
Returns may also be a significant motivator for convincing prospective buyers to click “buy now.” Customers’ concerns regarding buyer’s regret may be allayed if they are aware that your store offers free returns and exchanges. Refunds and returns should power your company, not consume it.
Monitoring these indicators is essential to your store’s health. Is a certain area of your store experiencing a spike in refund rates? It may be time to look into the source of it.
Ecommerce Churn Rate
A measure to monitor customer attrition is your churn rate. It calculates how many users have vanished over a specific time frame.
Your industry and sales strategy may require you to devote a significant amount of effort in each user experience. It’s critical to measure and develop ways to please your consumers while they are around, regardless of your turnover rate. Reselling to an existing client is usually simpler than acquiring a new one.
Advocacy Metrics.
Regrettably, this segment of the sales funnel is likely the most disregarded.
You have to treat these customers like the gold mine that they are.
You can gauge your attempts to demonstrate your concern for them with the aid of these measurements.
Net Promoter Score (NPS)
The likelihood that your clients will recommend you to others is what determines your net promoter score (NPS). Customers are categorized into one of three groups based on the number they provide.
- Detractors.
- Passives.
- Promoters.
Your score will improve with the number of promoters you have. It’s crucial to remember that different industries have varying excellent and negative NPS score systems. Everything about your company, from the caliber of your products to the caliber of your customer service, from the caliber of the customer experience to the caliber of the employment experience you provide your staff, will contribute to the improvement of your net positive score. All things are measured by NPS, which is an extremely useful instrument.
Subscription Rate
Knowing what proportion of your visitors have opted-in for your email lists is crucial because email marketing is still highly valuable. This is a positive indication that your clients want to hear from you.
You may increase your subscription rates by making sure that recipients of your emails have a positive experience with your brand, consistent content, and compelling calls to action. Additionally, you should avoid “spamming” your list with unending or pointless communications.
Conversely, the pace of unsubscribes holds equal significance to that of new subscriptions. It could be time to reevaluate your strategy if you’re witnessing large segments of users avoiding your emails.
There will always be unsubscribes, but it’s crucial to reduce them to less than 0.5%, with less than 25% being ideal.
Program Participation Rate
An increasing number of retailers are using review sites and loyalty programs as a means of lobbying as e-commerce practices and technologies have developed. There are a lot of options in both areas, but let’s take loyalty programs as an illustration since they might apply to you more if you are a retailer with a stronger brand.
What proportion of your overall clientele, if any, are members of your customer loyalty program? Your ability to treat them with care, make them feel unique, and enhance many other metrics we’ve covered, like CLV, repeat business, etc., will increase with that percentage.
By initiating one first, you can increase your program participation rate. Beyond that, proceed in a manner that will truly promote inclusivity. It is crucial to understand that servicing these clients well will eventually pay off even if some margin is sacrificed.
Recall the statistic we used before, which said that acquiring new customers is five to twenty-five times more expensive. It’s particularly crucial to remember it while considering the program participation rate.
Conclusion
Businesses should concentrate on taking a comprehensive strategy to evaluate these important indicators and KPIs to flourish in the dynamic world of e-commerce in 2024. To boost revenue, improve consumer experience, and streamline e-commerce operations, regularly evaluate data, spot trends, and make data-driven decisions. It will be imperative to adjust to shifting customer behaviors and market dynamics. Appic Softwares offers the ideal remedy. With state-of-the-art tools, we can build a very profitable app that has a distinctive brand, is feature-rich, and can grow quickly.
So, why do you hesitate?