Shein originally started their journey by selling wedding dresses and in early 2010 it introduced general women’s wear, by the middle of 2010, it started selling almost every type of women’s fashion.
Presently, Shein can be termed as one of the best-performing e-commerce stores that sell fashion products online. Here is a complete overview of Shein that you must have a look at before we dive into more statistics related to it-
Shein Overview
| Top Management | Chris XU (CEO), Quist Huang (Director, Employee Experience) |
| Business Type | Private |
| Launch Date | March 2008 |
| Industry | Shopping |
| Headquarters | Nanjing, China |
What Is Shein?
Shein is an online fast fashion store that has its headquarters in China. The company is known for selling relatively inexpensive clothes that are of high quality. It is a completely women’s store and provides dresses, tops, pants, and more.
Read This:- Role of AI and Real-Time Inventory in Quick Commerce Success
Shein Interesting Key Statistics 2025
- ZZKKO was the original name of Shein.
- Shein delivers to more than 150 countries.
- Shein had 230.6M active users in April 2023.
- 36.68% of the total users in Shein were from the US in April 2023.
- A potential late IPO in 2023, Shein was recently valued at $68 billion.
- Shein has more than 250M followers on Social media across every platform.
- The average time people spend on Shein is 7 minutes and 36 seconds.
- On average, a person visits 8.35 pages per visit.
Shein User Statistics 2023
Shein Monthly Visitors In 2023
| Month 2023 | Visitors (Million) |
| April | 230.6 |
| March | 237.0 |
| February | 199.5M |

Shein Anual Users
- Shein had 2.8 million users in 2008 and 65 million in 2022.
| Year | Users(mm) |
| 2017 | 2.8 |
| 2018 | 4.8 |
| 2019 | 5.6 |
| 2020 | 15.5 |
| 2021 | 43.7 |
| 2022 | 65 |

Shein Revenue 2023
- Shein saw a growth of 398% in their annual revenue from 2019-2021.
- In 2022 they earned $30 billion.
| Year | Revenue($bn) |
| 2016 | 0.61 |
| 2017 | 1.55 |
| 2018 | 1.99 |
| 2019 | 3.15 |
| 2020 | 9.81 |
| 2021 | 15.7 |
| 2022 | 30 |

How Much Is The Net Worth Of Shein?
- Shein was valued at $100 billion in 2022.
| Year | Worth ($bn) |
| 2019 | 5 |
| 2020 | 15 |
| 2021 | 30 |
| 2022 | 100 |
| 2023 | 64 |

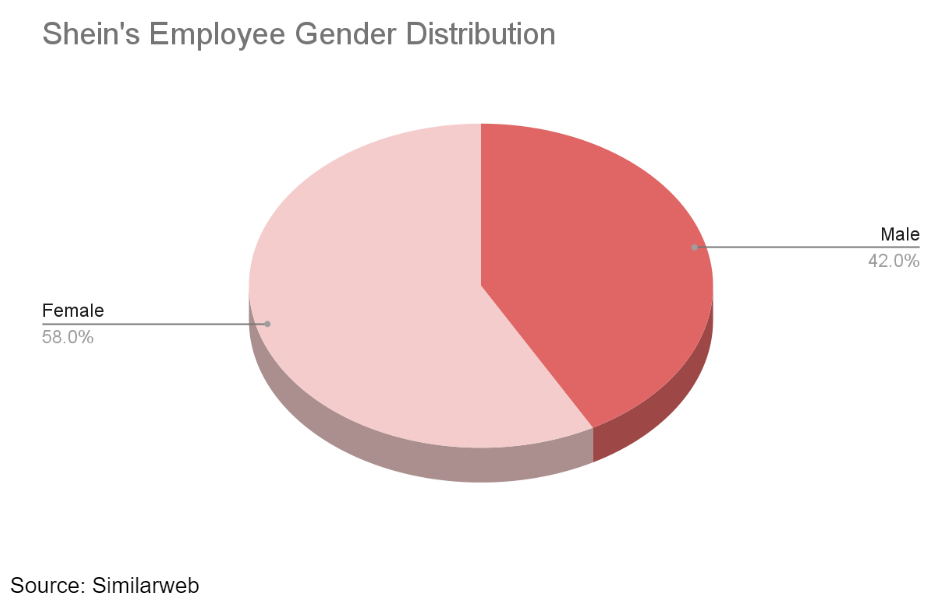
How Many People Work For Shein?
- Shein’s website claims that they have more than 10,000 employees working for them across the globe.
Gender Distribution On Shein
Shein Store Statistics 2023
How Many Designers Does Shein Have?
- As per a report from BBC, Shein currently has 200 designers in their store.
How Many Products Are Available In Shein?
- Shein currently has more than 600,000 products listed in their store.
What Is The Average Price Of Products In Shein Store?
- The average
price of products in the Shein store is $9 making it a major reason why people worldwide love to order from Shein.
What Is The Number Of Suppliers That Have Partnered With Shein?
- As of 2022, 3,000 suppliers were in partnership with Shein.
Shein Demographics 2023
Customer Gender Distribution On Shein

What Is The Age Distribution Shein?
- 25-34 year old accumulates the highest traffic (29.14%) on Shein followed by 18-24 year-olds (26.56%)
| Age | Distribution (%) |
| 18-24 | 26.56 |
| 25-34 | 29.14 |
| 35-44 | 18.14 |
| 45-54 | 12.41 |
| 55-64 | 8.38 |
| 65+ | 5.37 |

Which Country Has The Highest Visitors On Shein?
| Countries | Traffic(%) |
| United States | 36.68% |
| Brazil | 12.91% |
| France | 6.03% |
| Spain | 5.50% |
| Canada | 4.14% |
| Others | 34.73% |

Shein Traffic Statistics
Overview Of Shein Traffic
| Key Stats | Key Info |
| Monthly Visitors | 230.6 M |
| Daily Unique Visitors | 5,450,030 |
| Daily Page Views | 51,066,777 |
| Alexa Rank | 224 |
| Alexa Reach | 0.13% |
| Bounce Rate | 37.71% |
Source: Hyperstat
What Is The Market Channel Distribution On Shein?
| Marketing Channels | Traffic Distribution (%) |
| Direct | 48.20 |
| Referral | 0.82 |
| Organic Search | 17.28 |
| Paid Search | 19.77 |
| Social | 7.81 |
| 2.05 | |
| Display | 4.07% |

What Is The Social Media Traffic On Shien?
- As per reports, Facebook (61.94%) brings the highest traffic on Shien followed by Pinterest (15.93%)
| Social Media Channels | Traffic Distribution (%) |
| 61.94 | |
| 15.93 | |
| Youtube | 14.66 |
| Whatsapp Web | 1.89 |
| 1.75 | |
| Others | 3.83 |

Shein Mobile App Stats
Shein Android App Stats
| Launch Date | March 18, 2014 |
| Total Downloads | 100M+ |
| Rating Reviews | 4/5⭐ |
| Total Review Votes | 4.82M |
Source: GooglePlay
Shein iOS App Stats
| Launch Date | 20th May 2014 |
| Total Downloads | – |
| Rating Reviews | 4.4/5⭐ |
| Total Review Votes | 1M+ |
Source: Apple Store
Shien App Downloads Throughout The Years
- In 2015, Shein had 2.71 million app downloads, whereas in 2022 they had 184.98 million app downloads.
| Year | Number Of Downloads (mm) |
| 2015 | 2.71 |
| 2016 | 10.23 |
| 2017 | 18,66 |
| 2018 | 59.06 |
| 2019 | 68.26 |
| 2020 | 123.43 |
| 2021 | 177.49 |
| 2022 | 184.98 |

Shein Competitor
Zara V/S Shien
| Mode Of Comparision | Zara | Shien |
| Monthly Visitors | 86.9M | 230.6M |
| Category Rank (Lifestyle/Fashion) | #17 | #3 |
| Global Rank | #266 | #101 |
| Number of female users | 68.64% | 65.92% |
| Social channel that brings the highest traffic | Youtube (45.49%) | Facebook (61.94%) |
Source: Similarweb
Conclusion
By looking at the above statistics we can clearly say that Shein is growing at a fast pace. However, this wort dropped from $100M to $64M in 2023, but that was due to the valuation they raised.
However, if you are planning to launch a store similar to Shien, and looking for an eCommerce development company, then you should check out Appic Softwares. We have an experienced team of developers who can use all the latest technologies like Flutter, React, AI, Angular, and more to launch your application.
So, what are you waiting for?