When you run waste operations, you already know the real problem is not “lack of effort.”
It is fragmentation. Dispatch works in one tool. Billing works in another. Driver proof-of-service lives in photos, WhatsApp threads, and handwritten notes. Compliance reporting is rebuilt at month-end in spreadsheets by people who should be doing higher-value work.
Everyone is moving fast, but the system is still slow. And the pressure is only getting higher. Globally, municipal solid waste was estimated at 2.01 billion tonnes in 2016 and is projected to rise to 3.40 billion tonnes by 2050 (World Bank, What a Waste 2.0). UNEP’s 2024 outlook adds that the annual global cost of waste management was about $252B in 2020, and reaches $361B when pollution, health, and climate externalities are counted, with a business-as-usual trajectory significantly worse by 2050. In the U.S., EPA data shows 292 million tons of MSW generated in 2018, with only 32.1% recycled/composted.
Those aren’t abstract statistics. They show up as:
- overtime and fuel surprises,
- missed service disputes,
- revenue leakage from billing mismatches,
- and reporting risk during audits.
So the question is no longer “Should we digitize?” The better question is “How do we build a platform that operations will actually trust on Monday morning?” which is exactly what our waste management software development services are designed to answer.
Why a Unified Platform Beats Another Software Purchase?
Most organizations don’t start with a clean slate. They inherit mixed systems: a telematics vendor here, an accounting platform there, route sheets somewhere else, and maybe an old internal app no one wants to touch. Buying one more point solution often adds visibility in one department while increasing handoffs across the business.
A custom waste operations platform is different. It’s not “one giant replacement project.” It is the operating layer that connects:
- Route planning and live dispatch
- Driver app and proof of service
- Customer/resident portals
- Billing and contracts
- Compliance evidence and reporting
The win is not just a nicer UI. The win is a shared truth. When your route event, weight data, service completion, and invoice line item point to the same record, teams stop arguing about what happened and start solving what to improve.
What Custom Should Actually Mean and What It Should Not?
A lot of vendors use “custom” to mean visual tweaks. That is not enough for waste operations. Real custom platform work should reflect your operating realities:
- Service model: municipal zones, commercial contracts, on-demand pickups, industrial manifests, or mixed.
- Tariff complexity: contract rates, contamination surcharges, missed pickup credits, extra-haul charges.
- Fleet profile: rear-loaders, side-loaders, roll-offs, compactors, subcontracted vehicles.
- Compliance obligations: city-level forms, state requirements, EPA/RCRA-related workflows where relevant.
- Connectivity constraints: poor signal zones, offline-first driver flows, delayed sync tolerances.
Integration map: accounting, ERP, payment, CRM, telematics, scales, and identity systems. Custom should not mean writing everything from scratch just because you can. The right architecture mixes reusable foundations with operation-specific logic. You want speed now and flexibility later. The six platform layers every serious build needs
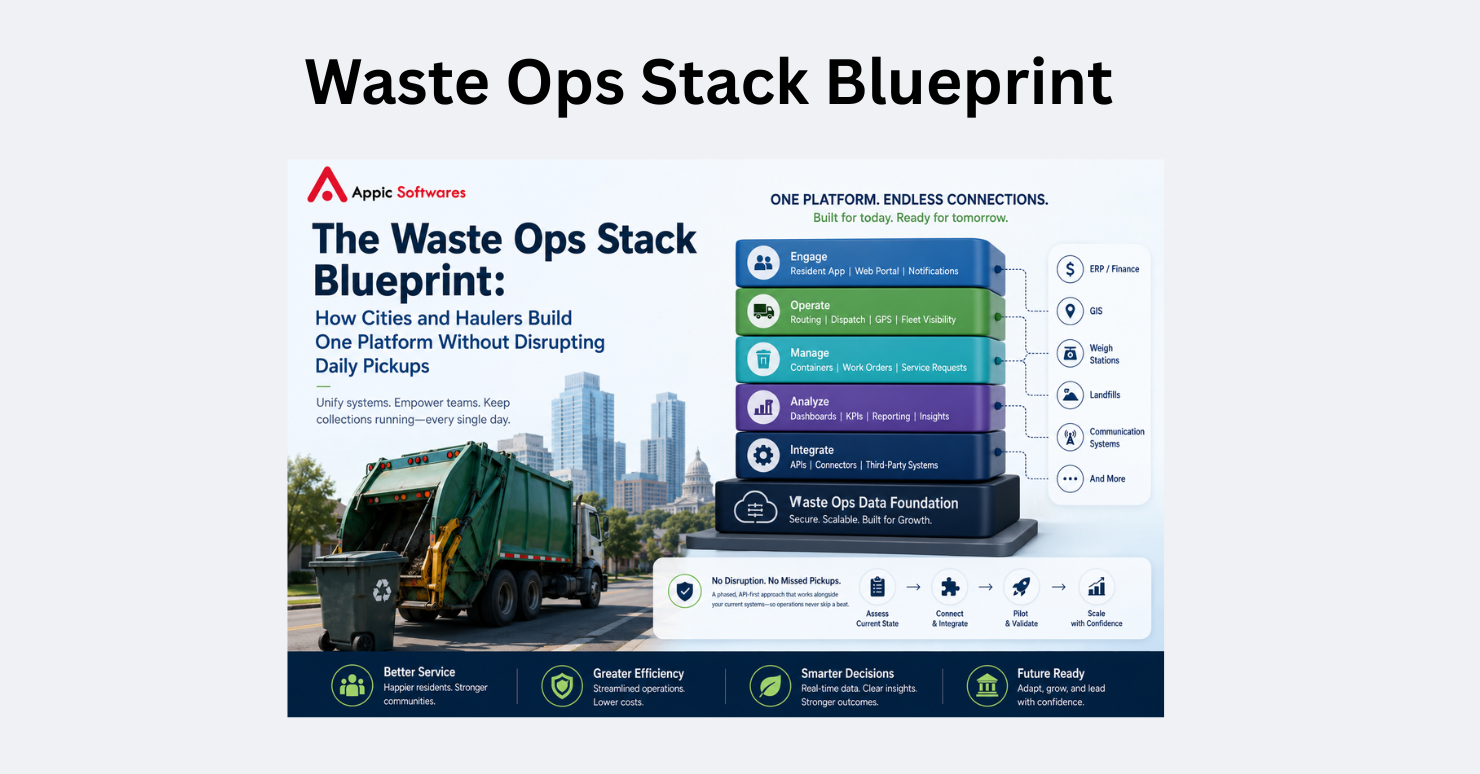
Whether you serve one city or multiple regions, the platform usually settles into six core layers.
1) Planning and Dispatch Layer
This is where service demand becomes executable routes.
Capabilities:
- zone and contract-aware route planning
- dynamic reassignment based on absence, traffic, or urgent calls
- exception management (missed stop, blocked access, contamination flags)
- dispatch board with live status and ETAs.
Business outcome: fewer dead miles, fewer “Where is the truck?” calls, more predictable shift completion.
2) Driver Execution Layer
If your driver app is clunky, the whole platform fails. Our mobile app development services power offline-first field apps built for real signal conditions and real route scenarios.
Capabilities:
- offline-first manifests and stop lists,
- navigation and sequence guidance,
- one-tap status updates,
- photo/signature/weight capture tied to stop events,
- incident tagging (contamination, bin damage, blocked access).
Business outcome: reliable field data, faster dispute resolution, reduced after-hours cleanup.
3) Customer/Resident Experience Layer
People care about one thing: was the service completed as promised?
Capabilities:
- service tracking and notifications
- request and complaint workflows
- pickup scheduling (where applicable)
- billing visibility and payment options
Business outcome: fewer support tickets, better trust, less pressure on call centers.
4) Commercial and Billing Layer
Revenue leakage often hides in the manual interpretation of service history.
Capabilities:
- Event-based invoicing
- Contract and SLA rule engine
- Surcharge automation
- Credit/debit workflows for service exceptions
- AR integration
Business outcome: cleaner invoices, lower DSO pressure, better margin protection.
5) Compliance and Audit Layer
Compliance pain usually comes from fragmented evidence, not a lack of effort.
Capabilities:
- digital chain of custody
- manifest lifecycle management
- timestamped audit trails
- export-ready reporting packages
- role-based approvals and access history
Business outcome: less pre-audit panic, lower penalty risk, stronger confidence in governance.
6) Intelligence and Analytics Layer
Maintenance prediction and anomaly detection only deliver value once data is stable and consistent. The underlying engine is machine learning development applied to event streams that your platform already captures.
Capabilities:
- route efficiency trends
- asset utilization by class
- contamination and recovery analytics
- customer SLA adherence
- cost-to-serve by zone/contract/site
Business outcomes: smarter pricing, better workforce planning, and a measurable ROI narrative for leadership.
The rollout strategy that avoids operational chaos
The biggest platform programs fail for one reason: they try to “big bang” everything.
A safer Pattern is Phased Modernization:
Phase 1: Instrument and Unify
Connect existing data sources. Normalize event models (pickup, completion, exception, weight, invoice trigger). Establish identity/roles and permission boundaries.
Goal: visibility without immediate behavior disruption.
Phase 2: Fix the Highest Pain Workflow
Choose one high-friction flow, typically:
- route + dispatch, or
- proof-of-service to billing handoff.
Goal: deliver an obvious operational win in weeks, not quarters.
Phase 3: Expand to Compliance + Customer Surfaces
Once field and finance records stabilize, add:
- compliance automation
- resident/customer self-service
- advanced analytics
Goal: convert early success into organization-wide adoption.
Phase 4: Optimize with Predictive Controls
Only after stable data quality:
- maintenance prediction
- dynamic service frequencies
- anomaly and leakage detection
Goal: compound value from a trusted data foundation
ROI model: where finance teams usually recover investment
Executives do not fund platforms for “digital transformation vibes.” They fund measurable outcomes.
Common Value Pools Include:
Fuel and Route Efficiency Gains
Better sequencing and live re-planning reduce avoidable mileage and idle costs.
Labor Productivity
Dispatchers spend less time manually coordinating exceptions. Back-office teams spend less time reconciling records.
Revenue Assurance
When invoice logic references actual service events, underbilling declines.
Compliance Risk Reduction
Digital evidence trails reduce reporting delays and penalty exposure.
Asset Uptime Improvement
Usage and telemetry signals support earlier maintenance actions.
A pragmatic payback conversation is usually framed in 9-18 months, depending on current process maturity, fleet size, and integration complexity.
Data governance and security: non-negotiables, not “phase-two nice-to-haves.”
Waste operations platforms touch operationally sensitive and commercially sensitive data. Security cannot be patched after launch.
Design Requirements Should Include:
- role-based access control by function and geography
- encryption in transit and at rest
- immutable logging for sensitive events
- controlled integrations (least privilege API scopes)
- auditable data retention and archival policies
- incident response runbook aligned to production support
This is also where many teams underestimate identity architecture. If dispatch, contractors, municipal stakeholders, and finance all need different access boundaries, model those boundaries early.
Integration reality: the platform is only as good as its connectors
No one is replacing every system tomorrow. Your platform must coexist with legacy and third-party tools.
High-Priority Integrations Usually Include:
- telematics and GPS feeds
- accounting/ERP
- payment gateways
- CRM/ticketing
- weighbridge/scale systems
- BI and reporting exports
A Strong Integration Strategy Uses:
- event-driven sync where freshness matters
- scheduled reconciliation where strict consistency is required
- failure handling and retry queues
- observability dashboards so ops can see connector health
If integration reliability is weak, user trust drops quickly, and teams revert to spreadsheets. Adoption: the human side that most projects underestimate. Technology projects fail socially before they fail technically.
Adoption Practices that Work
- Include dispatcher and driver representatives in design reviews
- Prototype real screens with real route scenarios
- Train by role with concrete “before/after” workflows
- Launch with floor support during initial shifts
- Track friction tickets aggressively for the first 30-60 days
One tactical tip: avoid training everyone at once. Train pilot teams deeply, capture their issues, stabilize, then roll out to additional zones.
KPIs That Prove the Platform is Working
Pick a short KPI set that leadership and frontline teams both understand:
- on-time pickup rate,
- route completion variance,
- fuel cost per route or per ton,
- missed service dispute resolution time,
- invoice accuracy/credit note rate,
- compliance report preparation time,
- contamination trend by stream/site,
- unplanned vehicle downtime.
Then define baseline values before rollout. Without a baseline, every post-launch discussion becomes opinion.
Common Mistakes to Avoid
Starting with a UI redesign before data model alignment
Pretty screens won’t fix broken event relationships.
Treating compliance as documentation output
Compliance starts in workflow design, not month-end export templates.
Assuming AI creates value before data is stable
Predictive features need disciplined, consistent event capture first.
Underfunding change management
If training and support are thin, adoption stalls and ROI slips.
Skipping phased release governance
Controlled cutovers protect service continuity and stakeholder confidence.
What a Practical First 90 Days Can Look Like?
A realistic first quarter often follows this cadence:
Weeks 1-2: discovery, workflow mapping, baseline KPI setup.
Weeks 3-4: architecture decisions, integration plan, data contracts.
Weeks 5-8: dispatch + driver workflow build for pilot scope.
Weeks 9-10: supervised pilot in selected zones/contracts.
Weeks 11-12: issue hardening, billing/compliance handoff prep.
Weeks 13+: staged expansion and analytics packaging.
This approach balances urgency with operational safety. If your team is still reconciling route events, proof-of-service, and invoices by hand on the weekend, the platform conversation is no longer optional. Book a free consultation with our waste software team.
Final Takeaway
Waste operations are becoming more data-intensive, more regulated, and more visible to citizens, customers, and boards. As volume and scrutiny increase, fragmented tooling becomes more expensive every quarter. A unified waste ops platform is not about chasing a trend. It is about replacing brittle handoffs with reliable execution.
The organizations that win are not necessarily the ones with the biggest IT budgets. They are the ones that sequence modernization wisely: connect systems, solve one painful workflow well, prove value quickly, then scale with confidence. If your team is still spending week-ending energy reconciling route events, proof-of-service, and invoices by hand, the platform conversation is no longer optional. It is operational risk management.
Sources used (for real data points)
- World Bank — What a Waste 2.0 (global waste from 2.01B tonnes in 2016 to 3.40B by 2050): World Bank What a Waste 2.0
- UNEP — Global Waste Management Outlook 2024 (cost figures and projections): UNEP GWMO 2024
- U.S. EPA — Advancing Sustainable Materials Management: Facts and Figures (292M tons MSW, 32.1% recycling/composting in 2018): EPA Facts and Figures