4 Easy Steps To Integrate Power BI With Shopify

Shopify's built-in reports cover the basics: sales, orders, customers and traffic. Once you want to blend store data with ad spend, inventory, finance, or multiple stores, a BI tool helps. Microsoft Power BI lets you model that data once and share interactive dashboards across your team.
Important: Power BI has no built-in, first-party Shopify connector, so you connect through a third-party connector, the Shopify API, or a data warehouse. This guide compares all three.
Shopify Orders, products, customers. A. Connector app / ODBC B. Direct Admin API C. ETL to warehouse Power BI Desktop: model and measure Service Dashboards, refresh, sharing
ower BI.
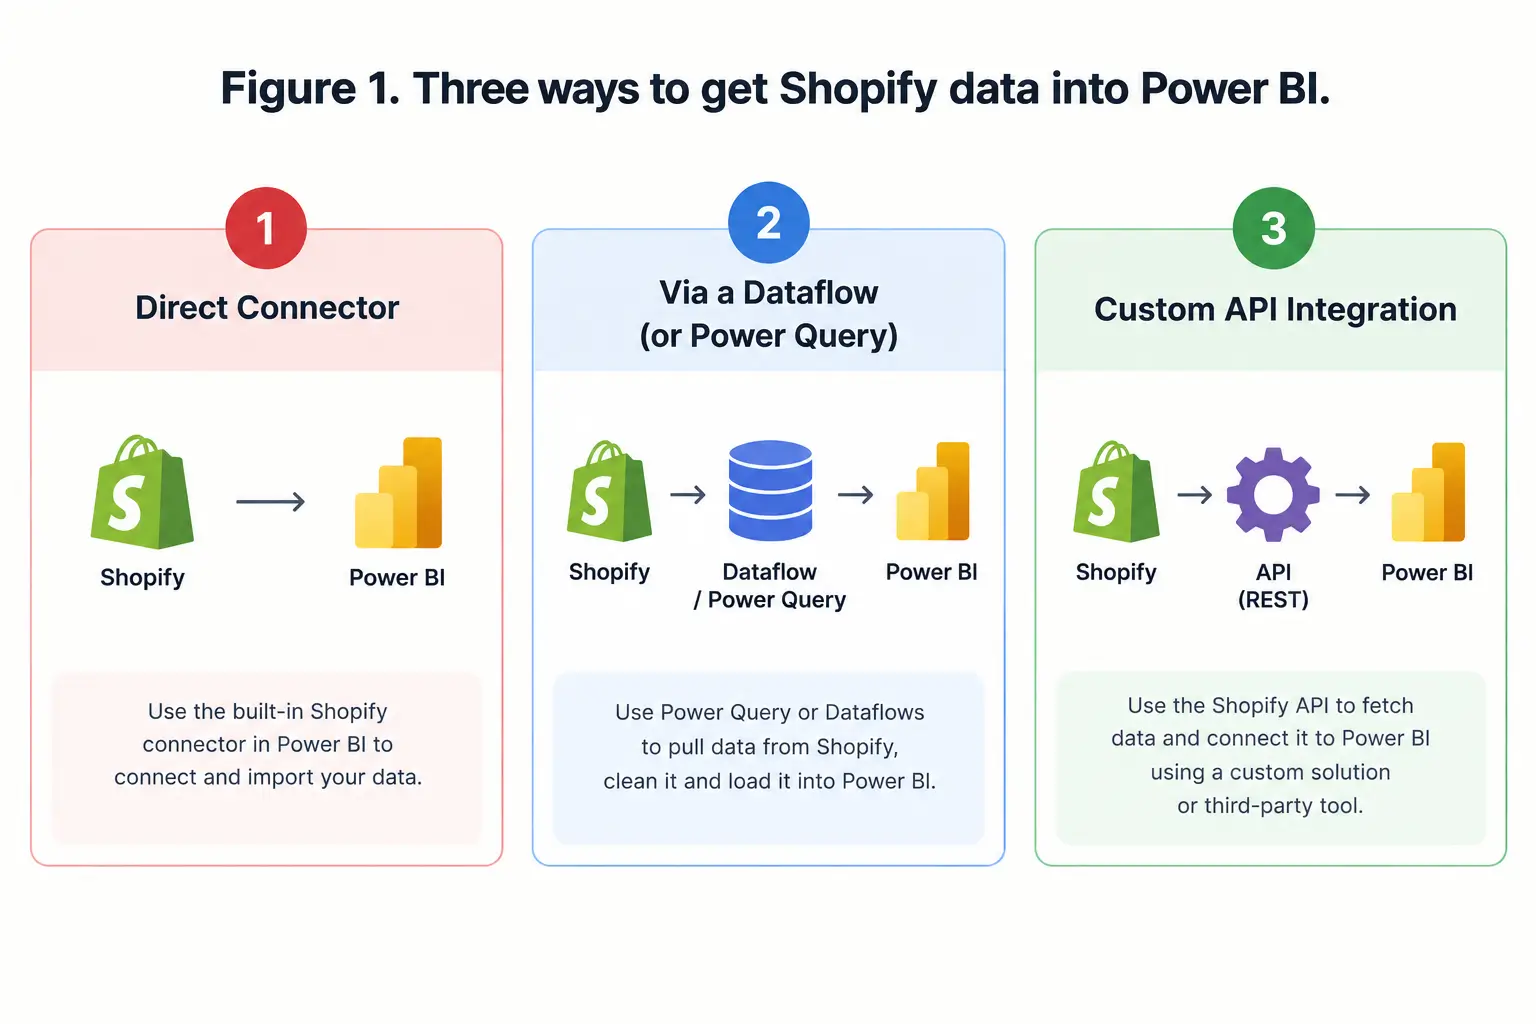 Current integration methods compared
| Method | How it works | Best for | Watch out for |
| A. Connector app or ODBC driver | A Shopify app such as Power BI Connector, a no-code tool such as Coupler.io, or the CData connector exposes Shopify as tables or an OData URL. | Most stores; fastest setup | Paid plans, row limits, and refresh frequency vary by vendor. Some require a gateway. |
| B. Direct API with Power Query | Call the Admin GraphQL API from Power Query using Web.Contents and a custom app access token. | Developers needing custom fields | Pagination, rate limits, and token security are on you. The REST Admin API is legacy, so prefer GraphQL [verify current Shopify policy]. |
| C. ETL to a warehouse | Sync Shopify to BigQuery, Snowflake, Azure SQL or Microsoft Fabric with an ETL tool, then connect Power BI to the warehouse. | Multiple stores, large data, blended sources | Extra cost and setup; best long-term foundation. The CData connector documentation describes a GraphQL data model with tables such as Orders, Customers, Products, ProductVariants, and Refunds, and supports both Import and DirectQuery modes. |
Before you start: checklist
- Power BI Desktop (free) and a Power BI Service account if you want to share dashboards.
- Shopify admin access to install apps or create a custom app with read scopes such as
read_orders,read_productsandread_customers. Older order history may need extra access, so check Shopify's scope docs. - A list of the questions you want answered, so you export only the tables you need.
Step-by-step workflow (Method A)
Exact screens differ between connector vendors; the flow below is the common pattern.
Step 1. Install the connector
Open the connector's listing in the Shopify App Store, click Add app, review the permissions, and select Install app.
Shopify App Store install screen
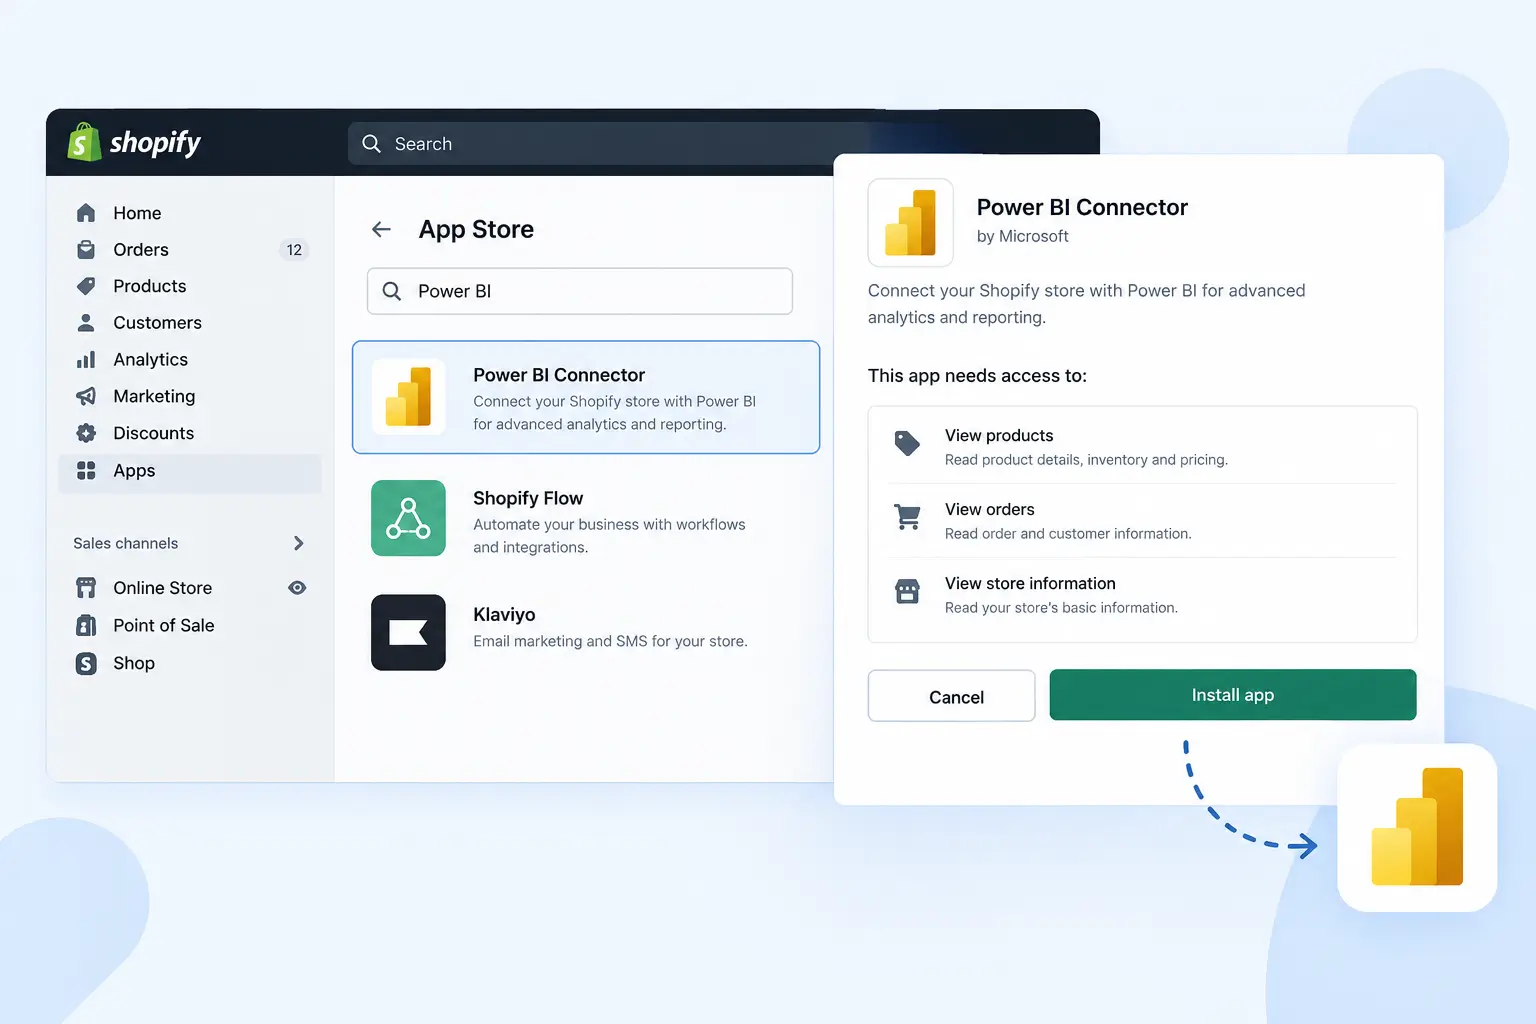
Installing the Power BI connector in Shopify.
Step 2. Create a data source
Choose New data source, add a name and optional schedule, tick the tables and fields you need (orders, line items, products, customers, refunds), and add filters such as a date range to keep the dataset light. Save.
Step 3. Prepare the data
From the Actions menu, choose Start. Wait for the status to change to Ready; larger stores take longer. Then copy the data source URL.
Step 4. Import into Power BI Desktop
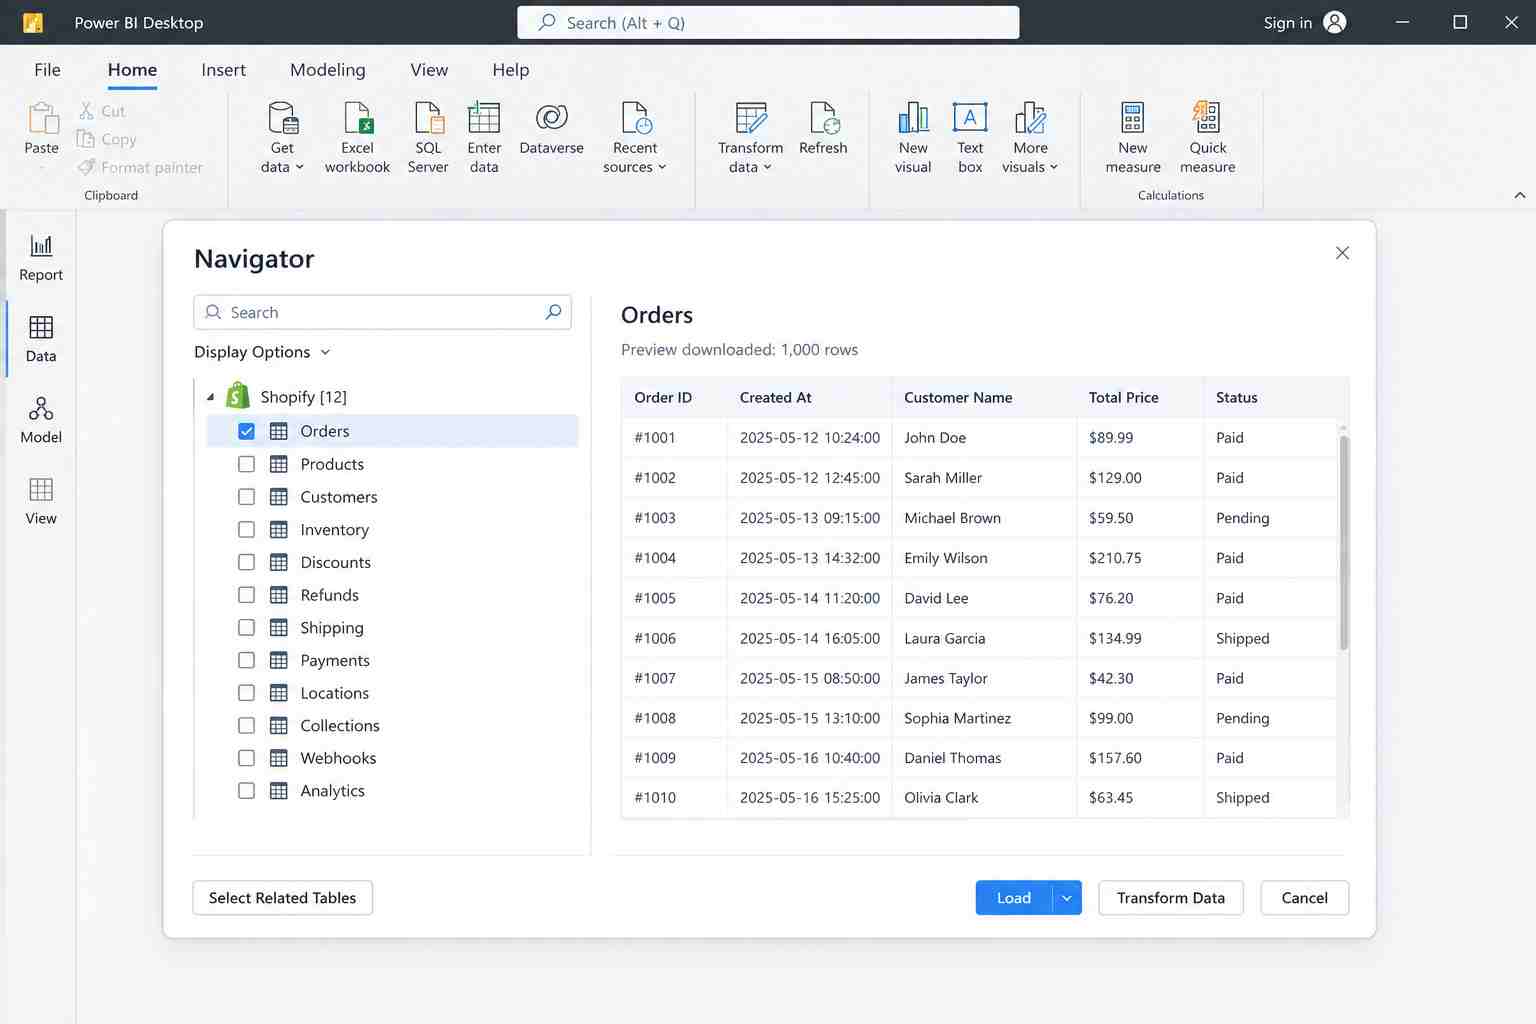
Go to Home → Get data → OData feed (or Web, depending on the connector), paste the UR,, L and sign in with the credentials shown in the connector's settings page. Pick your tables, then choose Transform data to clean them in Power Query or Load to import directly.
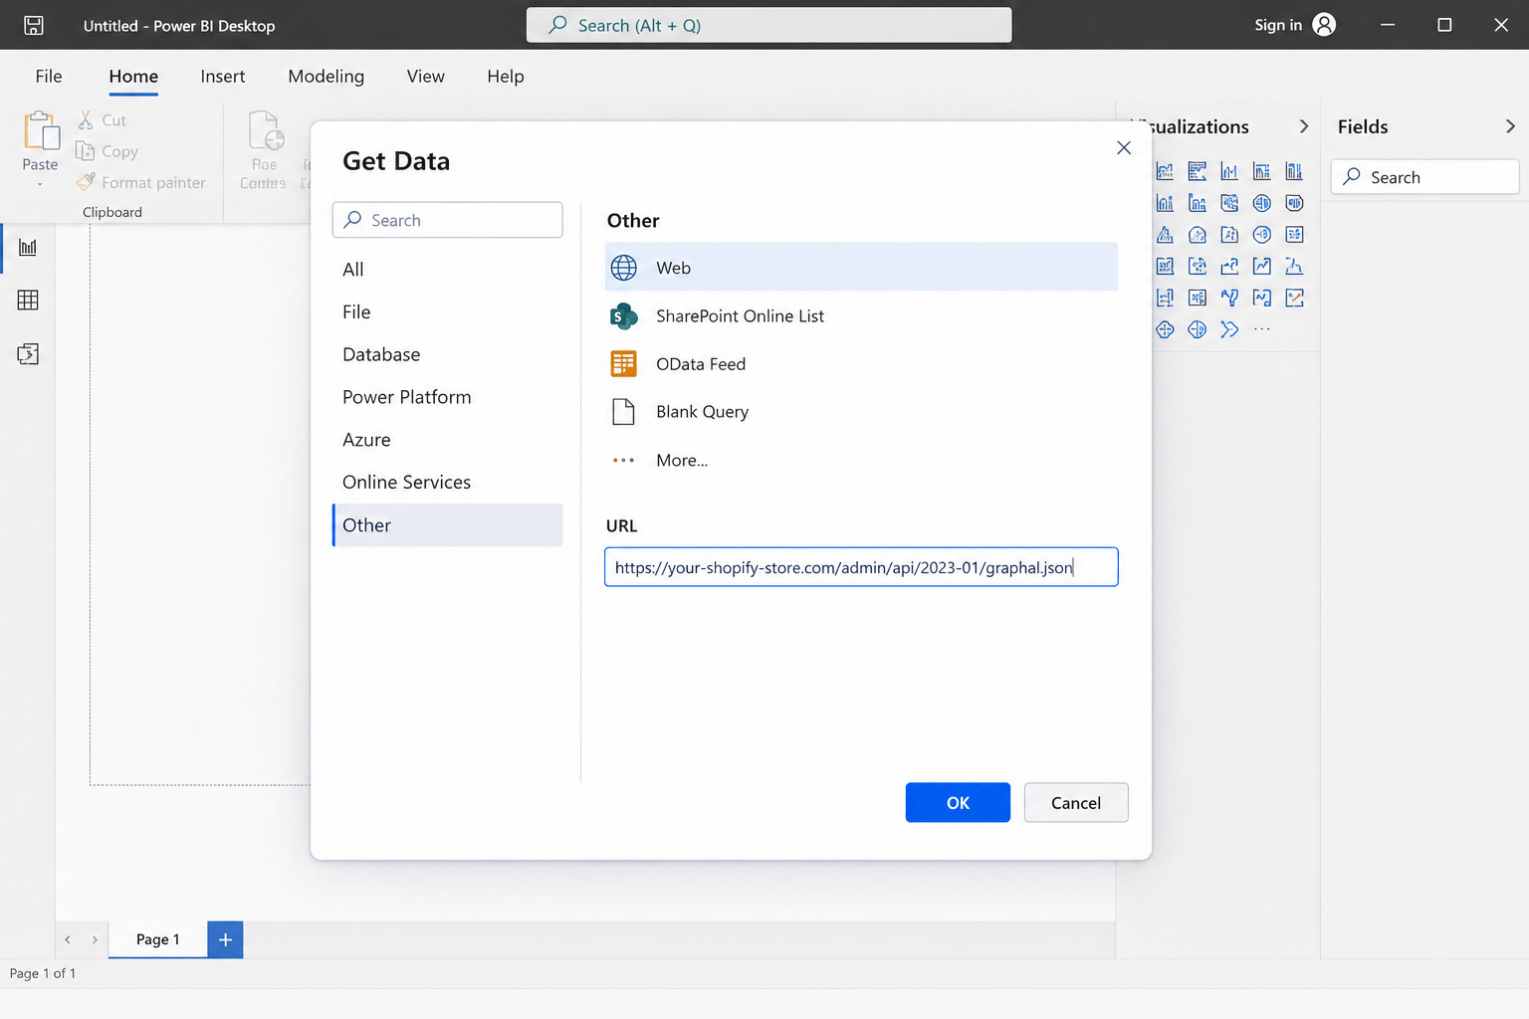
Power BI Get Data dialog showing the Web connector selected and a Shopify API URL entered in the URL field.
Step 5. Build the model
- Relate
OrderstoCustomers, andOrder line itemstoProducts, using ID columns. - Add a date table and mark it as the date table for time intelligence.
- Create measures, for example
Net Sales = SUM(Orders[TotalPrice]) - SUM(Refunds[Amount])andAOV = DIVIDE([Net Sales], DISTINCTCOUNT(Orders[OrderID])). Column names depend on your connector.
Step 6. Publish and schedule refresh
Click Publish to send the report to the Power BI Service, then set a scheduled refresh in the semantic model settings. Scheduled refresh limits depend on your Power BI licence, so check Microsoft's refresh documentation.
Method B in brief: Direct API
- In Shopify admin, create a custom app and grant read-only scopes. Store the access token in a Power BI parameter or secrets store, never in shared files.
- In Power Query, use
Web.Contentswith the GraphQL endpoint (https://your-store.myshopify.com/admin/api/VERSION/graphql.json) and theX-Shopify-Access-Tokenheader. - Page through results with cursors, or use Shopify's bulk operations for large exports.
- Pin the API version and review it each quarter, because versions are retired on a schedule.
Dashboards to build first
Net sales$128.4k Orders2,184 Avg order value$58.80 Repeat rate31% Revenue by month Top products Product A Product B Product C Product D Figure 4. Illustrative layout with sample numbers, not real data.
| Dashboard | Key Metrics | Useful visuals |
| Sales overview | Net sales, orders, AOV, refunds, discounts | Line chart by day or month, KPI cards |
| Products and inventory | Units sold, revenue by product, stock levels, sell-through | Bar chart, matrix, low-stock table |
| Customers | New vs returning, repeat rate, lifetime value, cohorts | Cohort matrix, map, decomposition tree |
| Marketing and channels | Revenue by source, ad spend vs sales (blend with ad data) | Combo chart, scatter |
| Fulfillment and returns | Fulfillment time, return rate, reasons | Funnel, bar chart |
Design tips: keep one page per question, put KPIs on top, add date and channel slicers, and use drill-through for order-level detail.
Troubleshooting
| Problem | Likely cause | Fix |
| Connector not listed in Get data | Custom ODBC or connector file not in the expected folder | Create the Custom Connectors folder under Documents → Power BI Desktop, or install the vendor's driver, then restart Desktop and check security settings for third-party connectors. |
| Only some rows returned | API pagination or default page size | Use a connector that handles pagination, or add cursor paging or bulk operations in Method B. |
| Authentication or 401/403 error | Wrong credentials, expired token, or missing scope | Re-copy credentials from the connector settings page, or add the needed read scopes and regenerate the token. |
| Rate limit or throttling errors (429) | Too many API requests at once | Reduce tables and date range, stagger refresh times, or use bulk exports or a warehouse. |
| Refresh works in Desktop but fails in Service | Local ODBC source needs a gateway, or credentials are not set | Install an on-premises data gateway or use a cloud connector, then re-enter data source credentials. |
| Totals don't match Shopify | Time zone, refunds, cancelled or test orders, currency, tax, and shipping handling | Align time zones, exclude test and cancelled orders, subtract refunds, and compare the same definitions. |
| Slow report | Importing every field and years of history | Remove unused columns, filter history, use a star schema, and consider incremental refresh. |
| Missing or old orders | Date filter, access scope limits | Widen the filter and check the app's order access scopes. |
Security and governance
- Use read-only access and the minimum scopes you need.
- Treat customer data as personal data: limit who can view it, and consider hiding emails and phone numbers in shared reports to meet GDPR or CCPA duties.
- Use workspace roles and row-level security if different teams or stores should see different data.
- Rotate tokens and remove unused connector apps.
Need help?
If you would rather not build this yourself, Appic Softwares can set up the connector or warehouse pipeline, design the data model, and build custom Power BI dashboards for your store. Contact the team to get started.
Frequently Asked Questions
Q.What is Power BI?
A.Power BI is a business analytics tool by Microsoft that helps you visualize data and share insights across your organization. It enables users to connect to multiple data sources, including Shopify, to create real-time dashboards and reports.
Q.Why should I integrate Power BI with Shopify?
Integrating Power BI with Shopify allows you to: Track real-time sales data Monitor product performance Visualize customer behavior and order trends Make data-driven decisions to improve your eCommerce strategy
Q.What are the steps to integrate Power BI with Shopify?
A.Here are the four simple steps: Export Shopify Data using apps like Supermetrics, Stitch, or CSV export Use a Data Connector or third-party integration tools like Panoply or Power BI connectors Import Data Into Power BI and format it using Power Query Create Dashboards & Reports to visualize sales, orders, customers, and product data
Related Articles

Multi-Agent Systems for Real Estate: How AI Teams Are Reshaping Property Operations in 2026

How Agentic AI Is Transforming Real Estate Operations in 2026