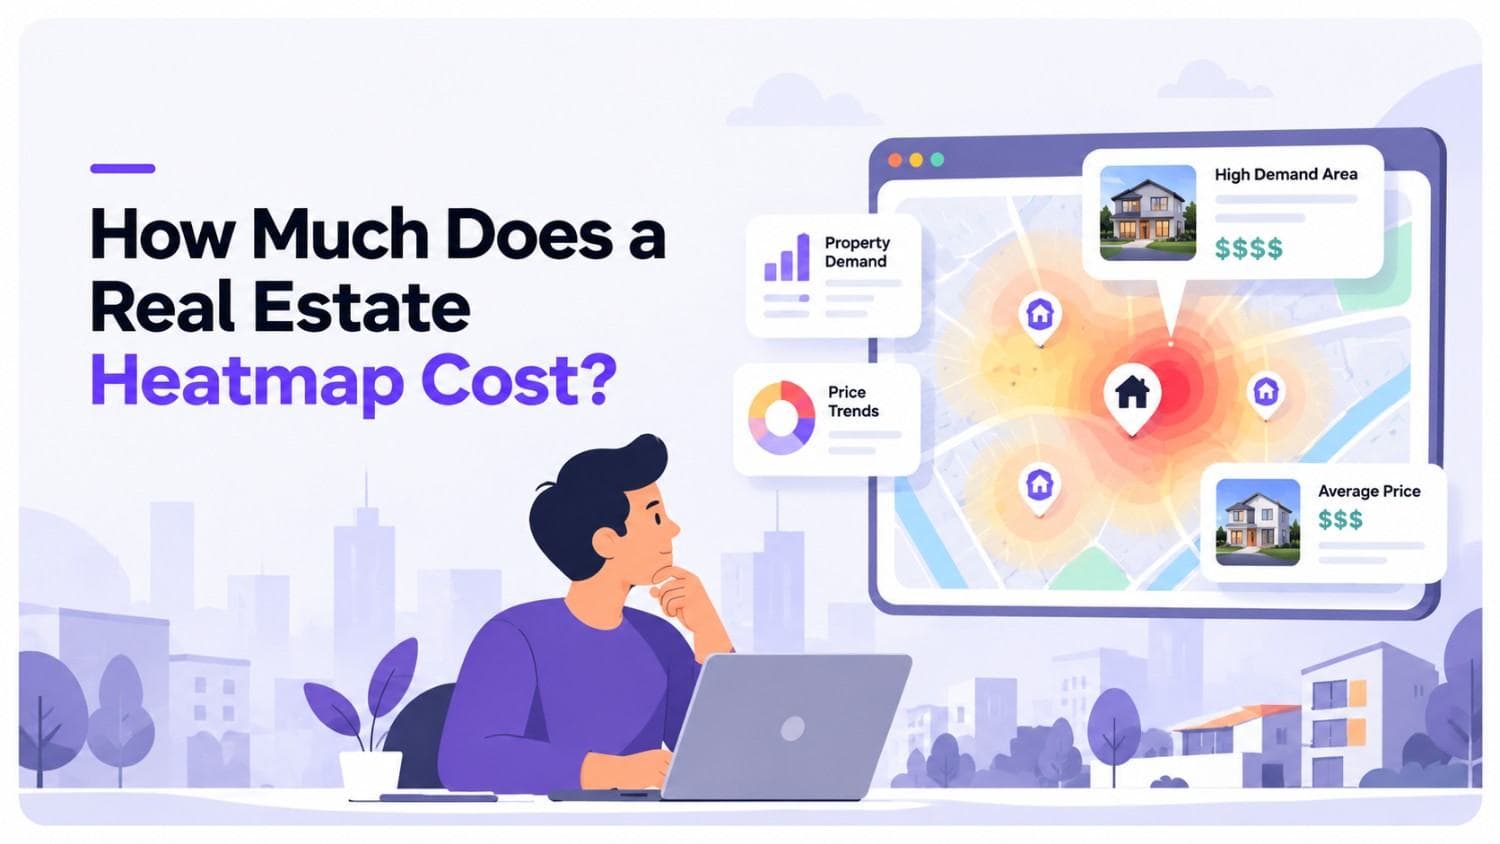
how much does a real estate heatmap cost?
A real estate heatmap typically costs $4,000 to $80,000+ to build and integrate, depending on scope. Expect 15–20% of the build cost per year for maintenance, API usage and data licences. If you are still planning your product, start with our real estate app development and proptech development services.
| Tier | What you get | Indicative cost (USD) | Timeline |
| Starter | One layer (price per sq ft or listing density), basic filters, Leaflet/MapLibre or Mapbox | $4,000 – $10,000 | 3–6 weeks |
| Growth | 4–6 layers (price, yield, demand, crime, amenities), saved searches, admin dashboard, licensed data | $10,000 – $30,000 | 2–4 months |
| Advanced / AI | Predictive pricing, natural-language search, climate layers, real-time data, CRM integration, mobile apps | $30,000 – $80,000+ | 4–8 months |
Indicative ranges for planning. Your final quote depends on data sources, platforms, compliance and team model.
Graph idea 1: Stacked bar, "Cost by tier"
X-axis: Starter / Growth / Advanced. Segments: UX design, frontend + map, backend + data, AI/analytics, QA + DevOps. Alt text: "Real estate heatmap development cost by tier, 2026".
What is a real estate heatmap, and why does it matter in 2026?
A real estate heatmap colours areas by a property metric such as price per sq ft, rental yield, demand, crime, flood risk, or walkability. Users see hotspots in seconds instead of scrolling listings. Buyers and investors now expect data-backed neighbourhood comparison, and portals use heatmaps to raise engagement and surface premium listings in context.
Image idea 1 (hero)
Split screen: plain pin map on the left, same city as a cool-to-hot heatmap on the right. Alt text: "Pin map vs real estate heatmap comparison".
What is new in 2026–2027
1. AI and natural-language heatmaps
Users want to type "areas with rising rent and low flood risk under $400k" and get a live map. This needs an LLM layer on top of a clean data backend. See our work on generative AI in real estate and agentic AI in real estate operations.
2. Predictive layers
Platforms now show forecasted price movement and rental demand, not only history. This requires a data science pipeline, delivered through machine learning development, and is the biggest cost driver in the Advanced tier.
3. Climate and risk layers
Flood, heat, air quality and energy-efficiency overlays are becoming standard for buyers, lenders and insurers. Budget for third-party data licensing and normalisation.
4. Hex-grid aggregation and vector tiles
Aggregating data into uniform hexagons (for example with Uber's H3 index) gives cleaner comparisons and faster mobile rendering than irregular postcodes.
5. Open-source map stacks
MapLibre and Leaflet remove renderer licence fees, while Mapbox and Google Maps remain strong for styling, geocoding and routing.
6. Privacy and compliance
Heatmaps using behavioural or precise location data fall under rules such as GDPR and India's DPDP Act. Use aggregated or anonymised data where possible.
7. Mobile-first and real-time expectations
Smooth pan and zoom on phones pushes teams to vector tiles and caching. Our mobile app development and Flutter teams build these cross-platform.
Graph idea 2: Timeline infographic
2023 static price maps → 2024 filters and multi-layer → 2025–26 AI insights and climate layers → 2027 predictive, conversational, real-time maps.
Cost breakdown: where the budget goes
| Component | Covers | Share |
| Discovery and UX design | Metrics, colour scales, filters, wireframes | 8–12% |
| Map frontend | SDK, layers, tooltips, legends, performance | 20–25% |
| Backend and data pipeline | Ingestion, cleaning, geocoding, aggregation, APIs | 25–30%AI/analytics |
| s | Predictive scoring, NL search | 0–25% |
| Integrations | CRM, MLS feeds, auth, admin | 8–12% |
| QA, security, DevOps | Testing, monitoring, compliance | 10–15% |
Graph idea 3: Donut chart
Use the Share column for the Growth tier.
Map platform and API costs (2026)
| Provider | Free allowance (web) | Paid rate |
| Mapbox (GL JS) | 50,000 map loads/month | About $5 per 1,000, dropping to about $3 per 1,000 above 200K |
| Google Maps Platform | 10,000 free loads per API per month | Pricing was restructured in 2026; check the current plan |
| Leaflet / MapLibre | Free, open source | No renderer fee; pay for tiles, hosting, geocoding |
Worked example (Mapbox web map loads only): 40,000 loads = $0; 100,000 = about $250; 250,000 = about $900; 500,000 = about $1,650 per month. Geocoding, directions, and mobile users bill separately. Confirm rates on the provider pricing pages before budgeting.
Graph idea 4: Line chart, monthly map cost vs traffic
X-axis:s 10K–500K loads. Lines: Mapbox, Google Maps (current plan), open-source stack.
Data costs: the hidden budget line
Data is what makes a heatmap valuable. Sources include MLS and listing feeds, government open data, third-party vendors for yield, crime and climate, and your own platform behaviour. Budget $300–$5,000+ per month for a typical Growth-tier product. Pair it with our property recommendation engine and real estate reporting software to turn heatmap insight into leads and reports.
Image idea 2: Data-flow diagram
Sources (MLS, govt, vendors, user behaviour) → cleaning and geocoding → aggregation → heatmap layers → app.
Cost drivers
| Factor | Lowers cost | Raises cost |
| Layers | 1–2 metrics | 6+ metrics with comparison |
| Data freshness | Monthly refresh | Real-time pipelines |
| Platforms | Web only | Web + iOS + Android |
| Intelligence | Historical data | Predictive AI |
| Integrations | Standalone widget | CRM, MLS, analytics |
Build, buy or hybrid
Buy a widget for speed, build custom if the heatmap is your differentiator, or go hybrid (managed map SDK and licensed data, custom scoring and UX). Hybrid suits most teams, and an MVP-first approach keeps risk low.
Timeline
| Phase | Starter | Growth | Advanced |
| Discovery and design | 1 wk | 2–3 wks | 3–4 wks |
| Data pipeline | 1 wk | 3–5 wks | 6–10 wks |
| Map and frontend | 2 wks | 4–6 wks | 6–10 wkAI/analytics |
| cs | n/a | optional | 6–12 wks |
| QA and launch | 1 wk | 2 wks | 3–4 wks |
Graph idea 5: Gantt chart
Growth-tier phases with overlap between data pipeline and design.
Ongoing costs
- Map API usage, which grows with traffic.
- Data licences and refresh jobs.
- Hosting and tile storage.
- Model monitoring if you use AI.
- Maintenance, roughly 15–20% of build cost per year, through maintenance and support.
ROI of a heatmap
Track session duration, searches per user, enquiry rate and revenue per active user for 60–90 days after launch. Feed demand heatmaps into your real estate CRM for better lead scoring, and use Power BI dashboards for internal analytics.
Graph idea 6: Before/after bar chart
Engagement metrics pre- and post-launch. Use real client numbers from a case study if available.
8 mistakes that inflate heatmap budgets
- Starting with the map instead of the data strategy.
- Launching with too many layers.
- Ignoring map-load growth until the first big bill.
- Using raw point data on mobile without clustering.
- Rainbow colour scales that hide real differences.
- Skipping data-quality checks.
- Overlooking licence and privacy terms.
- Not planning maintenance.
Can heatmaps work for commercial real estate? Yes. Swap the data inputs and scoring logic; see our commercial real estate app development.
Get a free heatmap cost estimate. Planning a heatmap for a property portal or investor platform? Talk to Appic Softwares or hire dedicated developers. Also read: Multi-Agent Systems for Real Estate.
Frequently Asked Questions
What is a real estate heatmap?
A.A real estate heatmap is a visual tool that highlights geographic areas based on various property metrics such as price trends, rental yield, deman d, crime rate, or ROI potential. It helps buyers, investors, and realtors make data-driven decisions by showcasing property hotspots.
Why should I integrate a heatmap into my real estate app or website?
A.Integrating a heatmap offers many advantages: Enhances user experience with interactive visuals Helps users identify high-value or trending locations Adds data intelligence to property searches Increases app engagement and conversion rates Supports investment analysis and decision-making
What factors influence the cost of heatmap integration?
Type of mapping platform used (Google Maps, Leaflet, Mapbox) Data source and licensing fees (Zillow, MLS, local DBs) Filters and analytics added (price, ROI, safety, demand) Integration with backend dashboards or CRM Design customization and responsiveness Use of AI or predictive analytics
Related Articles

How To Create An App Like Zumper 2025?
The demand for reasonably priced residences in the rental market is rising due to the growing population. The need for Rental Search App Development has increased during the past few years as a result of the expanding rental market for affordable and moderately priced dwellings. Furthermore, when the number of tech-savvy people rises, there is […]

What Is Proptech In Sustainable Real Estate Development?
In addition to being one of the most lucrative indu stries in the world, real estate is also well known for its role in pollution and other environmental irritants. So much so that a study conducted in 2022 discovered that real estate accounts for more than 40% of carbon dioxide emissions worldwide. Although this has […]

PropTech Software Features: 14 Must-Haves, How to Prioritize Them and Options for Building
For software businesses aiming to enter the real estate market or for real estate organizations looking to use technology to enhance their operations, proptech software development can be a game-changer. Nonetheless, a number of important variables will determine how well your proptech software development project turns out. Take into consideration the following advice provided in […]

7 Proptech Trends In the Real Estate Industry 2026
The way real estate and technology have come together in recent years has drastically altered the market. Not only are innovations improving procedures, but they are also radically changing how consumers, brokers, property managers, and investors view and engage with real estate. A crucial query surfaces within the commotion around the growth of PropTech startups: […]
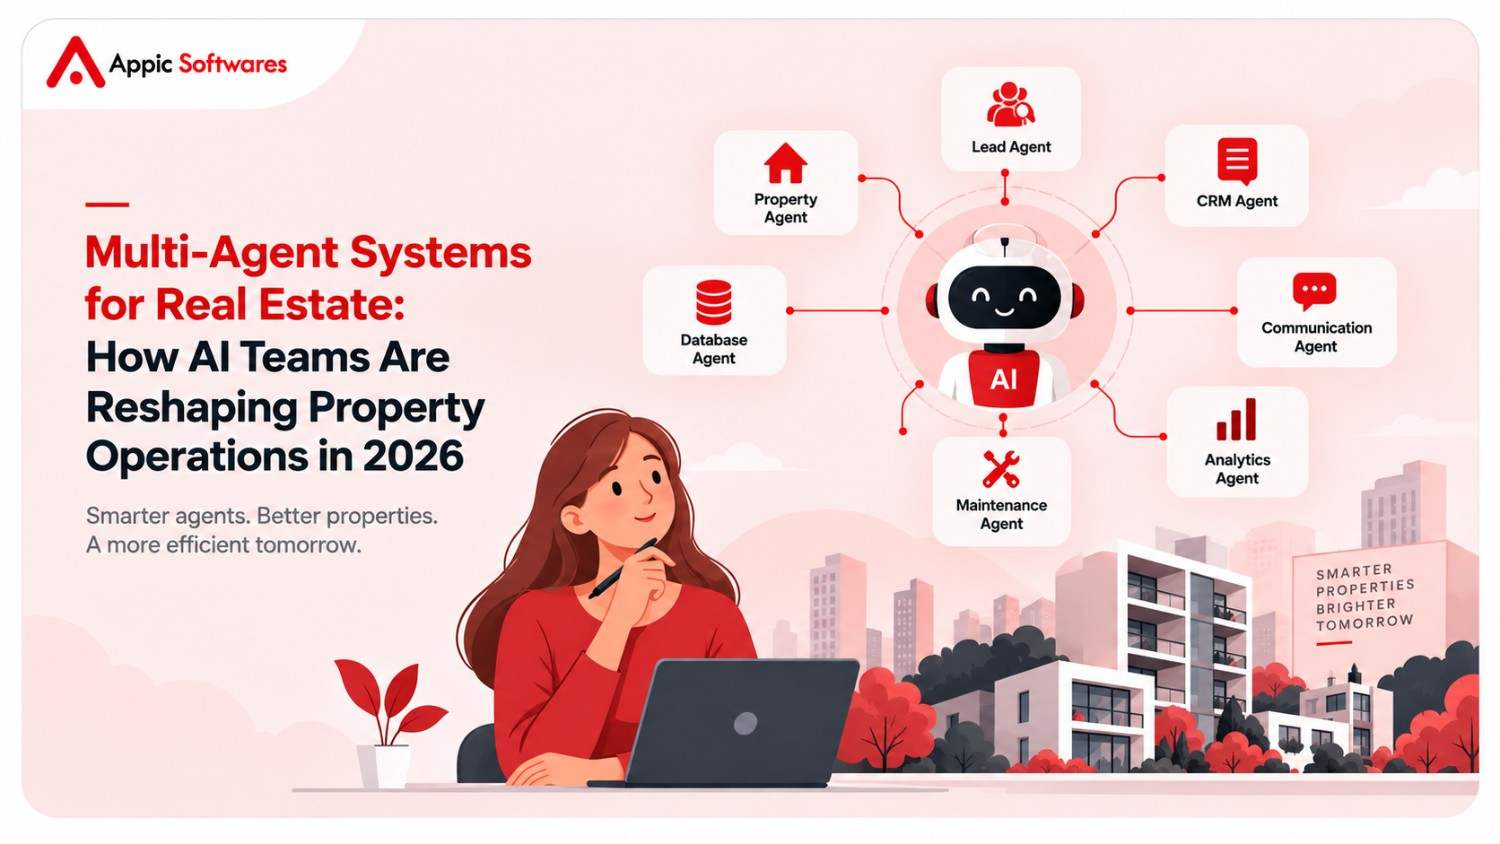
Multi-Agent Systems for Real Estate: How AI Teams Are Reshaping Property Operations in 2026